
Mario Kart
We chose to play Mario Kart to see if boys have a better lap time than girls. We had each person in our group race around Luigi's Circuit using Standard Kart M with Yoshi on Manual Transmission through the option of Solo Time Trials. We had each of our 5 boys race around Luigi's Circuit six times and recorded the Lap Time. We had each of our 2 girls race around Luigi's Circuit nine times and recorded their lap times. We decided to run a 2 Sample T Test for Means. This is our data.
Nathan I's Lap data
Lap 1: 34.98
Lap 2: 31.18
Lap 3: 32. 07
Lap 4: 31.66
Lap 5: 30.48
Lap 6: 31.27
Lap 2: 31.18
Lap 3: 32. 07
Lap 4: 31.66
Lap 5: 30.48
Lap 6: 31.27
Nathan B's Lap Data
Lap 1: 34.59
Lap 2: 30.92
Lap 3: 30.4
Lap 4: 30.4
Lap 5: 31.4
Lap 6: 31.57
Lap 2: 30.92
Lap 3: 30.4
Lap 4: 30.4
Lap 5: 31.4
Lap 6: 31.57
Temujin's LAp Data
Lap 1: 41.18
Lap 2: 33.25
Lap 3: 31
Lap 4: 31.61
Lap 5: 28.81
Lap 6: 30.17
Lap 2: 33.25
Lap 3: 31
Lap 4: 31.61
Lap 5: 28.81
Lap 6: 30.17
Mark's Lap data
Lap 1: 33.54
Lap 2: 32.51
Lap 3: 29.93
Lap 4: 30.31
Lap 5: 29.74
Lap 6: 29.41
Lap 2: 32.51
Lap 3: 29.93
Lap 4: 30.31
Lap 5: 29.74
Lap 6: 29.41
JonathOn's Lap data
Lap 1: 29.64
Lap 2: 29.94
Lap 3: 28.4
Lap 4: 30.1
Lap 5: 29.66
Lap 6: 28.78
Lap 2: 29.94
Lap 3: 28.4
Lap 4: 30.1
Lap 5: 29.66
Lap 6: 28.78
Amy's lap data
Lap 1: 35.26
Lap 2: 35.59
Lap 3: 32.18
Lap 4: 33.09
Lap 5: 31.24
Lap 6: 40.29
Lap 7: 32.25
Lap 8: 30.49
Lap 9: 31.35
Lap 2: 35.59
Lap 3: 32.18
Lap 4: 33.09
Lap 5: 31.24
Lap 6: 40.29
Lap 7: 32.25
Lap 8: 30.49
Lap 9: 31.35
Sara's lap data
Lap 1: 45.21
Lap 2: 34.77
Lap 3: 37.08
Lap 4: 42.43
Lap 5: 45.41
Lap 6: 37.24
Lap 7: 42.16
Lap 8: 35.24
Lap 9: 34.36
Lap 2: 34.77
Lap 3: 37.08
Lap 4: 42.43
Lap 5: 45.41
Lap 6: 37.24
Lap 7: 42.16
Lap 8: 35.24
Lap 9: 34.36
Group n x̄ s
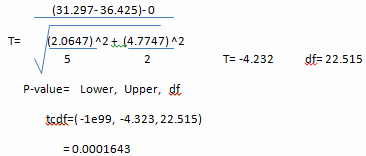
Males 5 31.297 2.4607
Female 2 36.425 4.7747
Males 5 31.297 2.4607
Female 2 36.425 4.7747
STEP 1: State
μ1= the true mean lap time for males in Mario Cart
μ2= the true mean lap time for females in Mario Cart
Ho= μ1-μ2=0
Ha= μ1-μ2<0
α= 0.05
μ2= the true mean lap time for females in Mario Cart
Ho= μ1-μ2=0
Ha= μ1-μ2<0
α= 0.05
Step 2: Plan
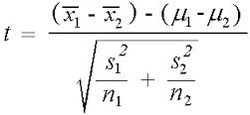
2 sample t test for μ1-μ2
Random - not random since we did not have an SRS. Our groups were based on grades. We will continue to proceed with caution.
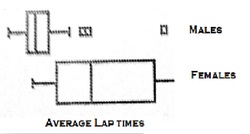
Normality -
the distribution for boys had three outliers while the distribution for girl is approximately symmetric. Although normality for the boys' distribution doesn't appear to be met, we will proceed with caution. Normality appears to be met for the girls' distribution.
Independent- We assume that the population of males that play Mario cart is N1> 10(5) = 50. We assume that the population of females that play Mario cart is N2> 10(2) = 20
Random - not random since we did not have an SRS. Our groups were based on grades. We will continue to proceed with caution.
Normality -
the distribution for boys had three outliers while the distribution for girl is approximately symmetric. Although normality for the boys' distribution doesn't appear to be met, we will proceed with caution. Normality appears to be met for the girls' distribution.
Independent- We assume that the population of males that play Mario cart is N1> 10(5) = 50. We assume that the population of females that play Mario cart is N2> 10(2) = 20
STep 3: Do
Step 4: COnclude
Since 0.0001642 < 0.05 (α), we reject the null hypothesis at the 5% significance level. Therefore, we can conclude that the true mean of males lap time who play Mario kart is less than the true mean of females who play Mario cart.

